What is a bone mineral density (BMD) scan? Osteoporosis is characterised by an absolute decrease in the amount of bone to the extent that bone strength is so severely compromised that fractures occur with minor trauma. Numerous studies have demonstrated that bone strength is related to bone density and this is what a BMD estimates. A BMD is a parameter of bone strength. This technique uses the absorption of X-rays to assess bone density. Briefly, a very fine X-ray beam is passed through a bone and the amount of the beam that is absorbed by the X-ray is used to calculate the bone density. Technically, this X-ray beam consists of a stream of particles termed photons, and depending on whether one or two beams are used, the technique is sometimes called single photon X-ray absorptiometry or dual photon X-ray absorptiometry (DEXA). This technique can be applied to virtually any bone in the body but as the most common sites of osteoporotic fracture are in the spine and femoral neck, these are the area most usually studied.
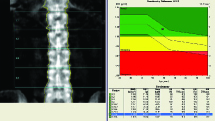
The analysis for the lumbar spine is the same as for the femur. On the left, the image of the patient’s lumbar spine is depicted with the regions of interest overlayed on the image. The results of the analysis are presented on the right side in both graphical and tabular form. In the graph, the patient’s BMD is indicated in relation to the age matched control group (mean + 1SD ). In the table, the patient’s BMD is given in absolute terms (g/cm2) and then compared to a young normal control group in terms of % of the mean of that group and the number of standard deviations from the mean (T score). Similar analysis is given for age matched controls in the far two columns for % and standard deviations (Z score).
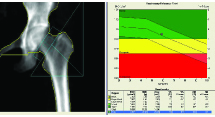
On the left, the image of the patient’s proximal femur is depicted with the regions of interest overlayed on the image. The results of the analysis are presented on the right side in both graphical and tabular form. In the graph, the patient’s BMD is indicated in relation to the aged matched control group (mean + 1SD ). In the table, the patient’s BMD is given in absolute terms (g/cm2) and then compared to a young normal control group in terms of % of the mean of that group and the number of standard deviations from the mean (T score). Similar analysis is given for age matched controls in the far two columns for % and standard deviations (Z score).
When do I order a BMD scan?
1. Detection of Osteoporosis a) Peri-Menopausal Women.
b) Early menopause (before age 45 years).
d) Corticosteroid therapy.
e) Hyperthyroidism.
f) Chronic renal failure.
g) Chronic liver disease.
h) Hyperparathyroidism.
i) Hypogonadism in males.
2. Monitoring Treatment in Osteoporosis
What do I tell the patient?
Allow 30 minutes.
No preparation is required.
The patient lies on a scanning bed and images of the lumbar spine and femur are taken. These images are then analysed to give the BMD at each site and these results are then compared to those of young normal patients.
What will the scan tell me?
Diagnosis of Osteoporosis.
Each scan is a digital X-ray of the area being studied. The important part of the scan is the quantitative analysis of this scan that is presented next to the images. The analysis lists the patient’s BMD and then compares it to a young normal group (T score) and an age matched group ( Z score). The most important number is the T score. The WHO recommends the following interpretation of a patient’s T score:
Up to –1.0 No osteoporosis present
Between -1.0 and –2.5 Osteopenia
Less than –2.5 Osteoporosis
Monitoring BMD.
The reproducibility of serial BMD measurements is approximately 0.05gm/cm2. In this way, only changes greater than 0.05 gm/cm2 can be confidently detected. As most therapies for osteoporosis give modest annual increases in BMD, even in patients who respond well to therapy may not have definite increases in BMD in the first year. It is also important to realise that extraneous factors can artificially elevate BMD. Osteoarthritis, particularly in the lumbar spine can often be responsible for such changes. Also, a crush fracture in the lumbar spine will elevate the lumbar spine BMD estimation.
What next?
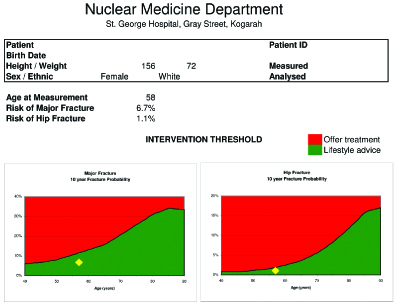
FRAX Risk Assessment
In the past, several authorities advocated that the decision to treat or not to treat could be made solely on the basis of BMD estimations. Nowadays, more sophisticated methods are available to integrate clinical risk factors and BMD estimations to predict the risk of fracture. This risk of fracture can then be used to suggest intervention thresholds that are cost-effective. The best known algorithm is FRAX which uses the clinical risk factors of age, sex, height, previous fracture, parent with previous fracture, current smoking, glucocorticoids, rheumatoid arthritis, secondary osteoporosis and alcohol consumption and BMD to calculate an individual’s risk for a osteoporotic fracture in the next ten years of a patient’s life.